Same Metrics, Different Physics: Unit Economics in Consumer Apps vs. Games
Four monetization models. Same metrics. Completely different economics. Here's what unit economics actually mean for your consumer app.
By: Omri Nygate, Behavioral Economist & Product Leader at Plunge
Sit in enough growth reviews and you notice something odd. An app team and a games team will open the same dashboard, look at the same three metrics - CPI, D7 ROAS, payback - and walk out with opposite conclusions about whether the business is working. Both are reading the numbers correctly, but both are often wrong.
The problem isn't the metrics. It's that we're using the same words to describe businesses that work completely differently. CPI means one thing when there's no ceiling on how much a user can spend, and something entirely different when your revenue per install tops out at a fixed subscription price. Same word. Same dashboard column. Completely different business underneath.
I've spent the last few months building out the numbers for my talk at Gamesforum London, trying to work out why the same metric family produces such divergent outcomes across monetization models. The answer turned out to be more structural than I expected. These aren't four strategies on a spectrum. They're four sets of physics, and confusing one for another is expensive in a way that shows up directly in your bid.
The four models, benchmarked
Four monetization models, one metric family: ad-focused, hybrid-casual, IAP casual, subscription.
Model | CPI | Net profit / install, 2 years | D7 ROAS |
Ad-focused | $0.65 | $0.26 | 47% |
Hybrid-casual | $4.25 | $2.93 | 28% |
IAP casual | $12.00 | $4.51 | 4% |
Subscription | $4.00 | $2.11 | 0% |
Now add the early signal most teams actually use to make decisions: D7 ROAS. Ad-focused returns 47% of spend in 7 days. Hybrid-casual: 28%. IAP casual: 4%. Subscription: 0% (not because the model is failing, but because no revenue exists before the trial converts).
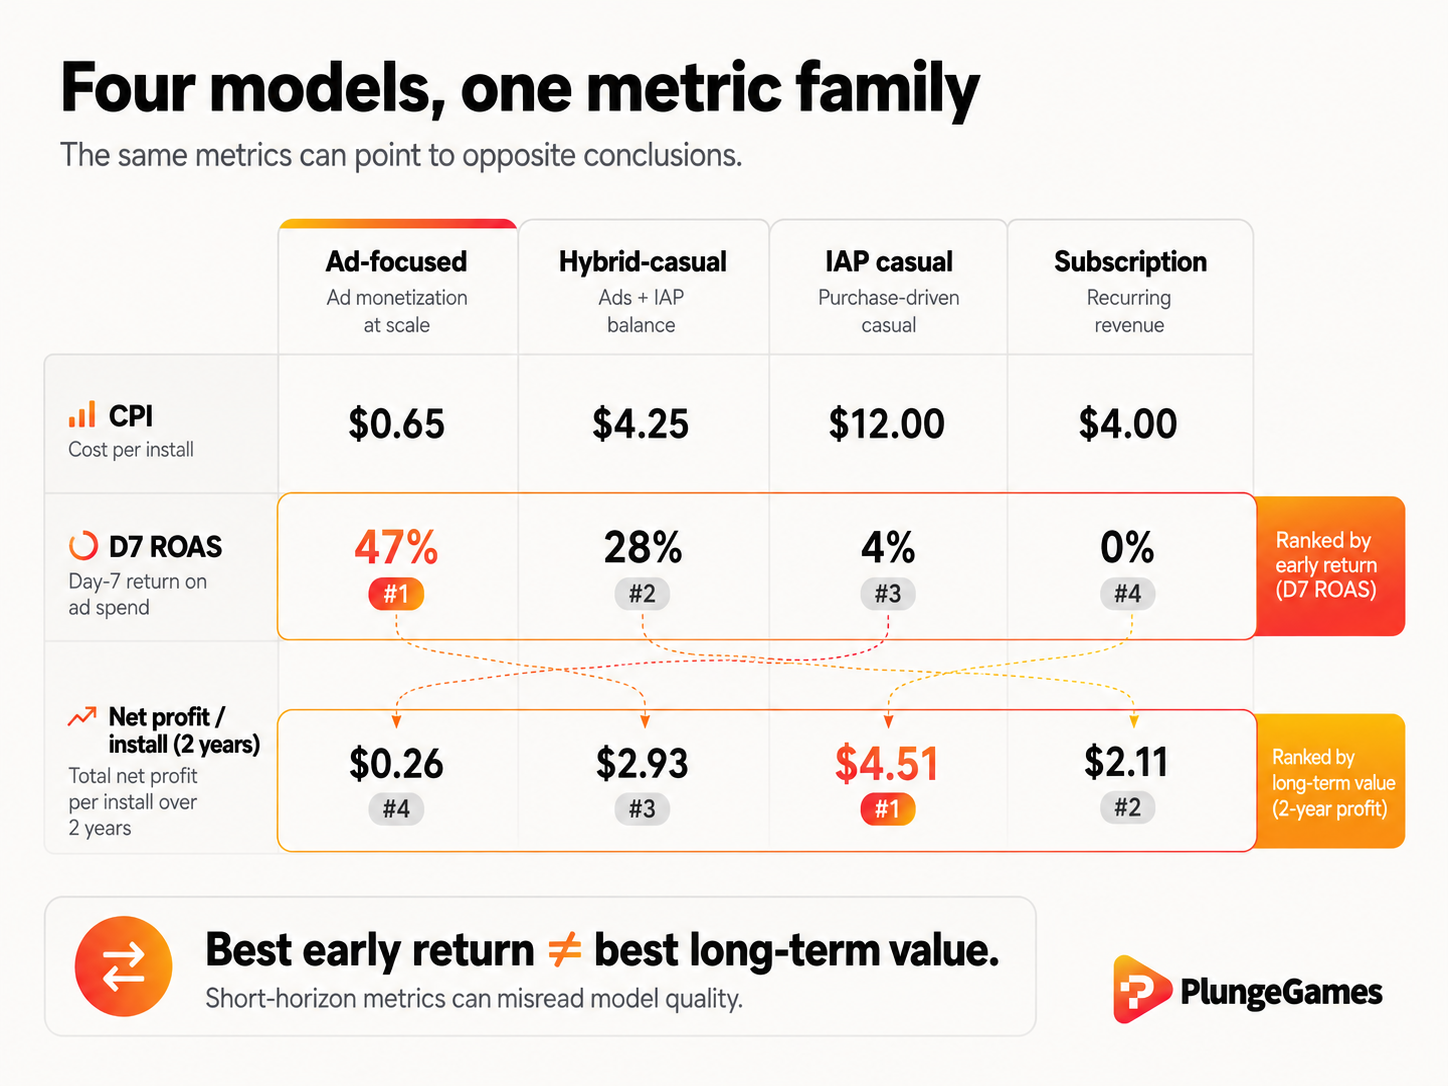
Now look at what happens two years down the line. The model with the strongest D7 ROAS ($0.65 CPI, 47% early return) nets $0.26 per install. The model with the weakest D7 ROAS - IAP casual at 4% - nets $4.51. That's a 17x gap in profit, and the rankings are almost entirely inverted - D7 ROAS tells you ad-focused is winning and IAP casual is broken. Two-year profit says the opposite.
On the numbers. Inputs — CPI, ARPDAU, retention, conversion — are drawn from published benchmarks: Sensor Tower's State of Mobile 2026, Tenjin, AppsFlyer's State of Gaming for Marketers 2026, and Liftoff's 2025 Casual Gaming Apps Report. Everything downstream is modelled, not measured: revenue curves, payback days, and all Y1/Y2 figures are built from those inputs. Retention is interpolated between anchor points; ARPDAU decays for ad and hybrid and rises for IAP via payer-mix shift; anything past D30 is extrapolation. All figures net of store fees. This is a working example chosen to be representative at mid-scale — real values vary by geo, genre and channel. The shapes are the point, not the absolute values.
What happens when a user loves you 10x more?
That's the question that separates these businesses, and it has three different answers.
In an ad-focused game: A player who loves it ten times more watches roughly twice as many ads. Revenue is impressions x eCPM, and neither term responds much to enthusiasm. Attention is finite - there are only so many hours, and only so many interstitials you can place.
In a subscription app: That same user pays $9.99. Exactly $9.99. The price is the ceiling, and it's a ceiling you set yourself. The user who would happily have spent ten times more has no mechanism available to do it.
In an IAP game: They can spend as much more as they want - let’s call it a hundred times more - because spend is a choice (rather than a unit).
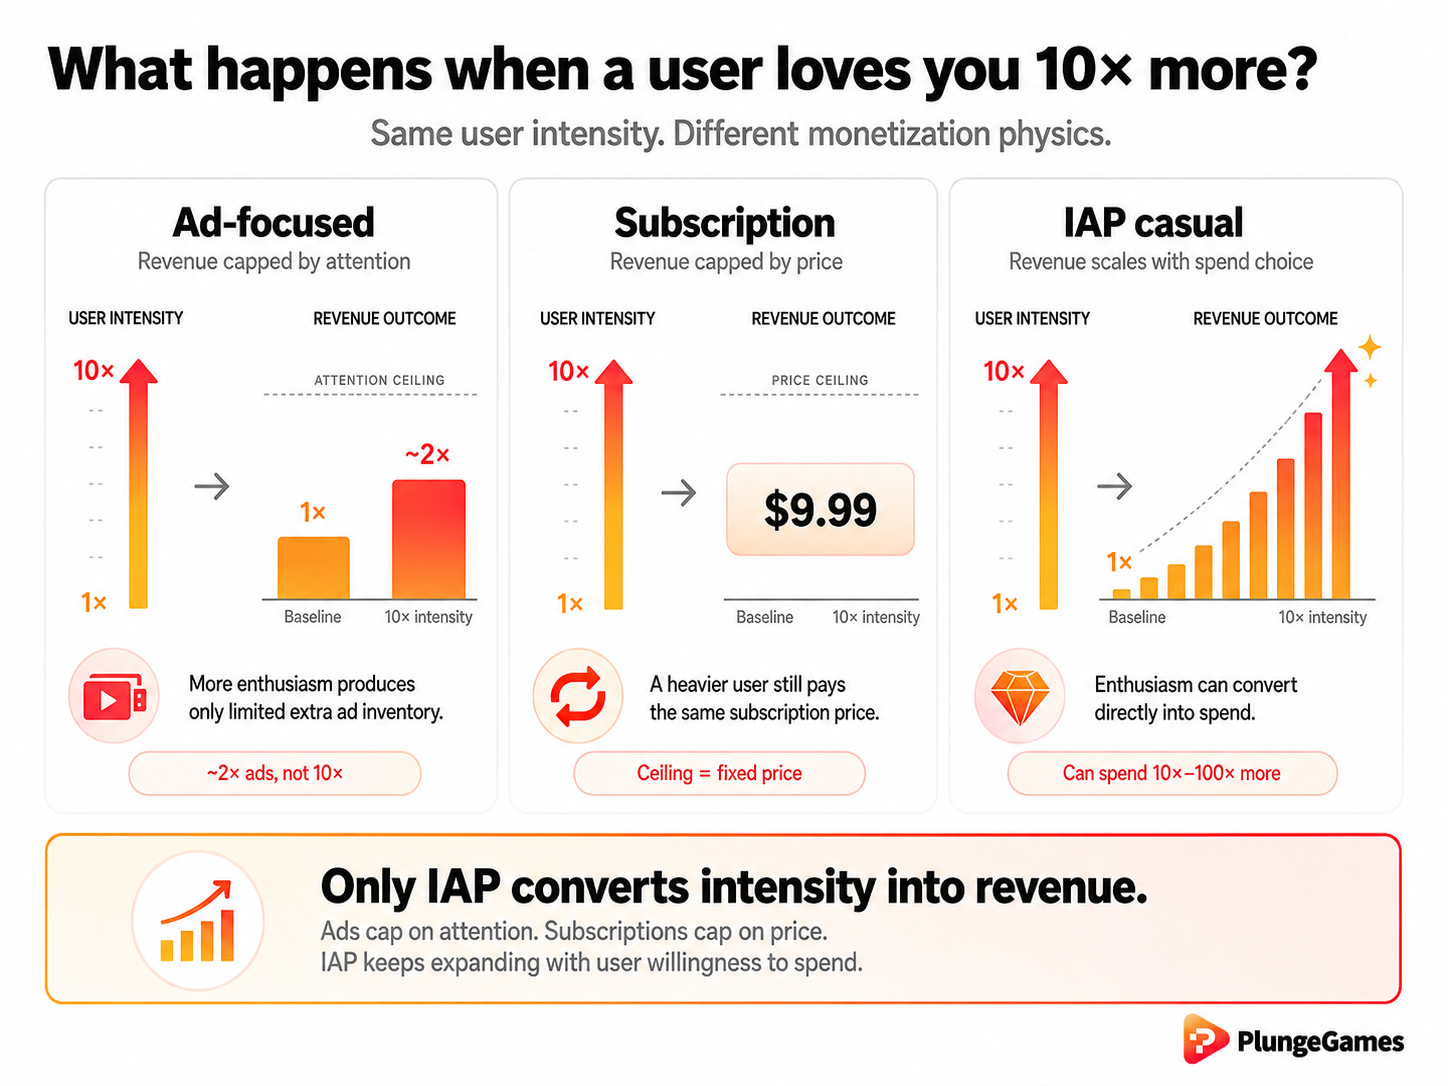
Which produces the claim I keep coming back to: ad-focused and subscription are structurally the same business. They look nothing alike, with different audiences, different products, and different rooms at different conferences. But both cap revenue at a unit that doesn't scale with intensity. One caps on attention. The other caps on price.
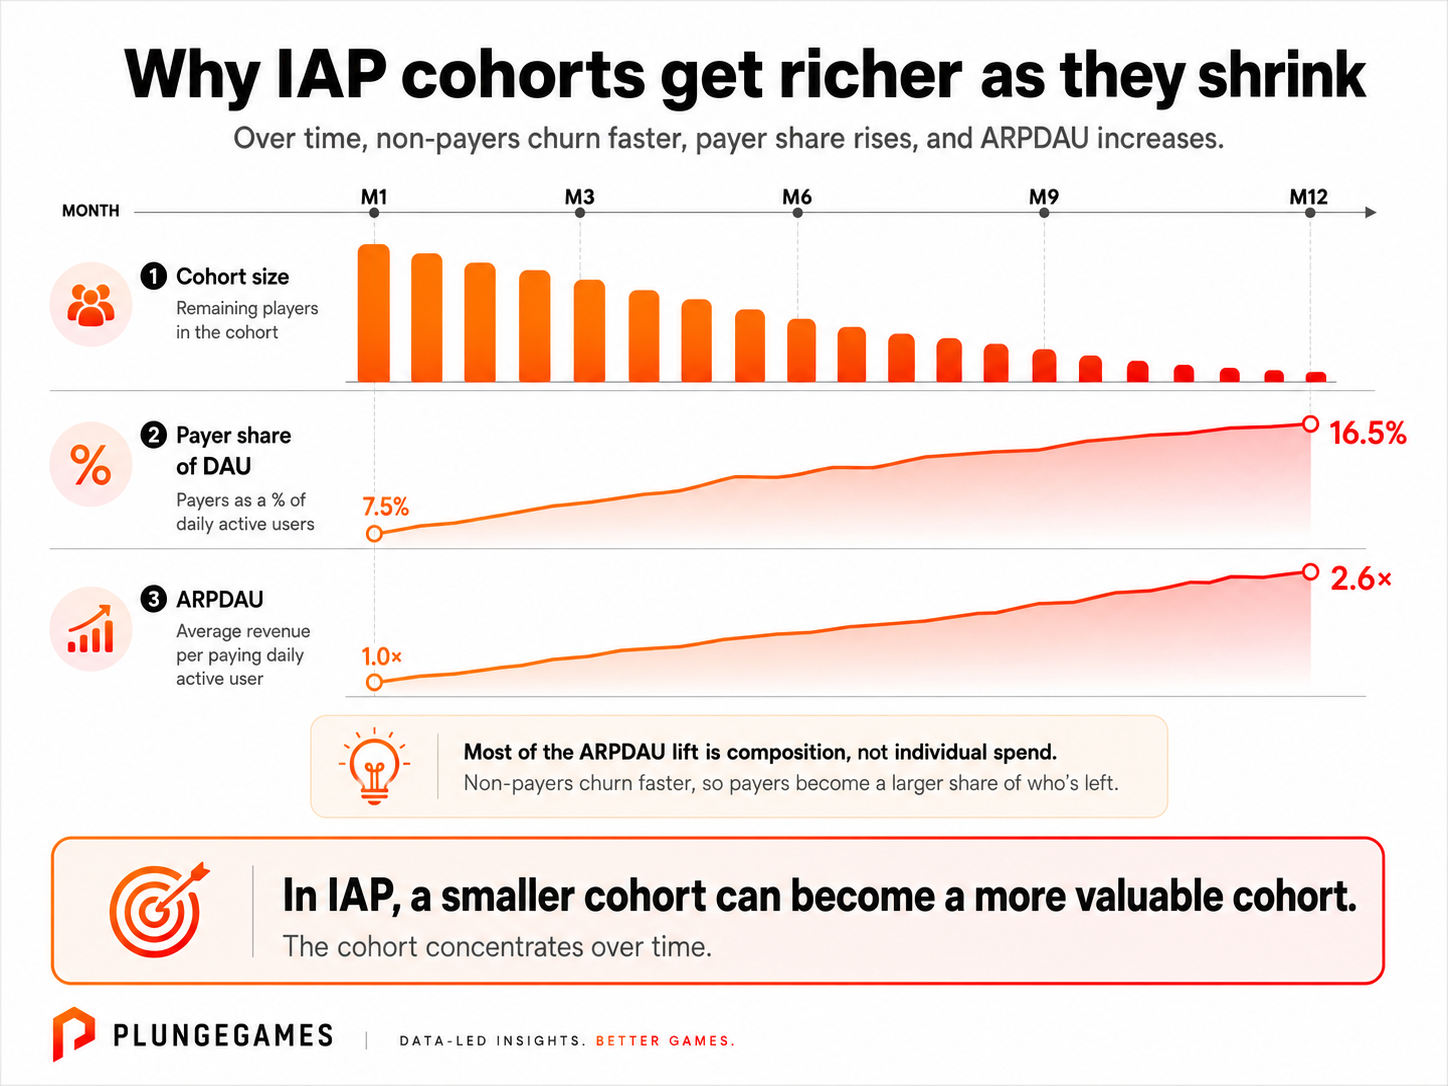
Only IAP converts intensity into revenue, and that's why an IAP cohort gets richer as it shrinks. Payer share of DAU climbs from 7.5% to 16.5% across Year 1. ARPDAU rises 2.6x over the same window. Notably, most of that ARPDAU growth isn't players spending more - it's composition. Non-payers churn faster, so payers become a rising share of who's left.
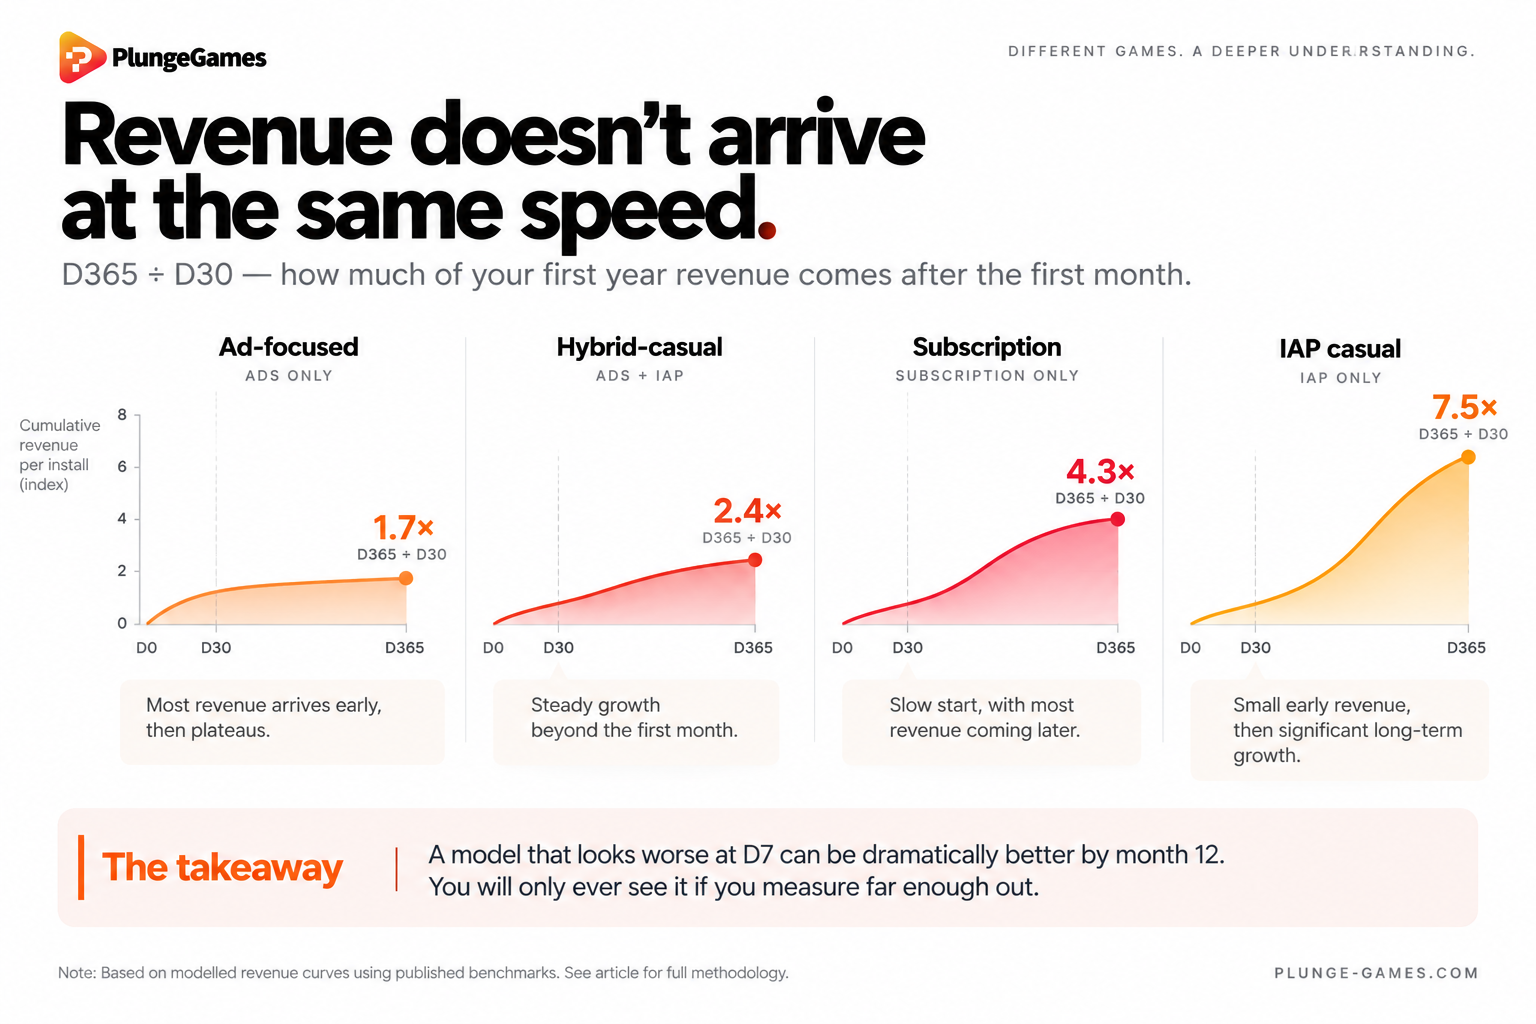
Not every model collects its money at the same point. Ad-focused earns most of its revenue in the first few weeks, but once users churn, the income stops. IAP casual keeps earning longer, because the users who stay spend more over time. Take D365 ÷ D30, which measures how much of your first year’s revenue arrives after the first month:
Model | D365 ÷ D30 |
Ad-focused | 1.7x |
Hybrid-casual | 2.4x |
Subscription | 4.3x |
IAP casual | 7.5x |
A model that looks worse at D7 can be dramatically better by month 12. You will only ever find out if you're measuring far enough out to see it.
The scaling ceiling
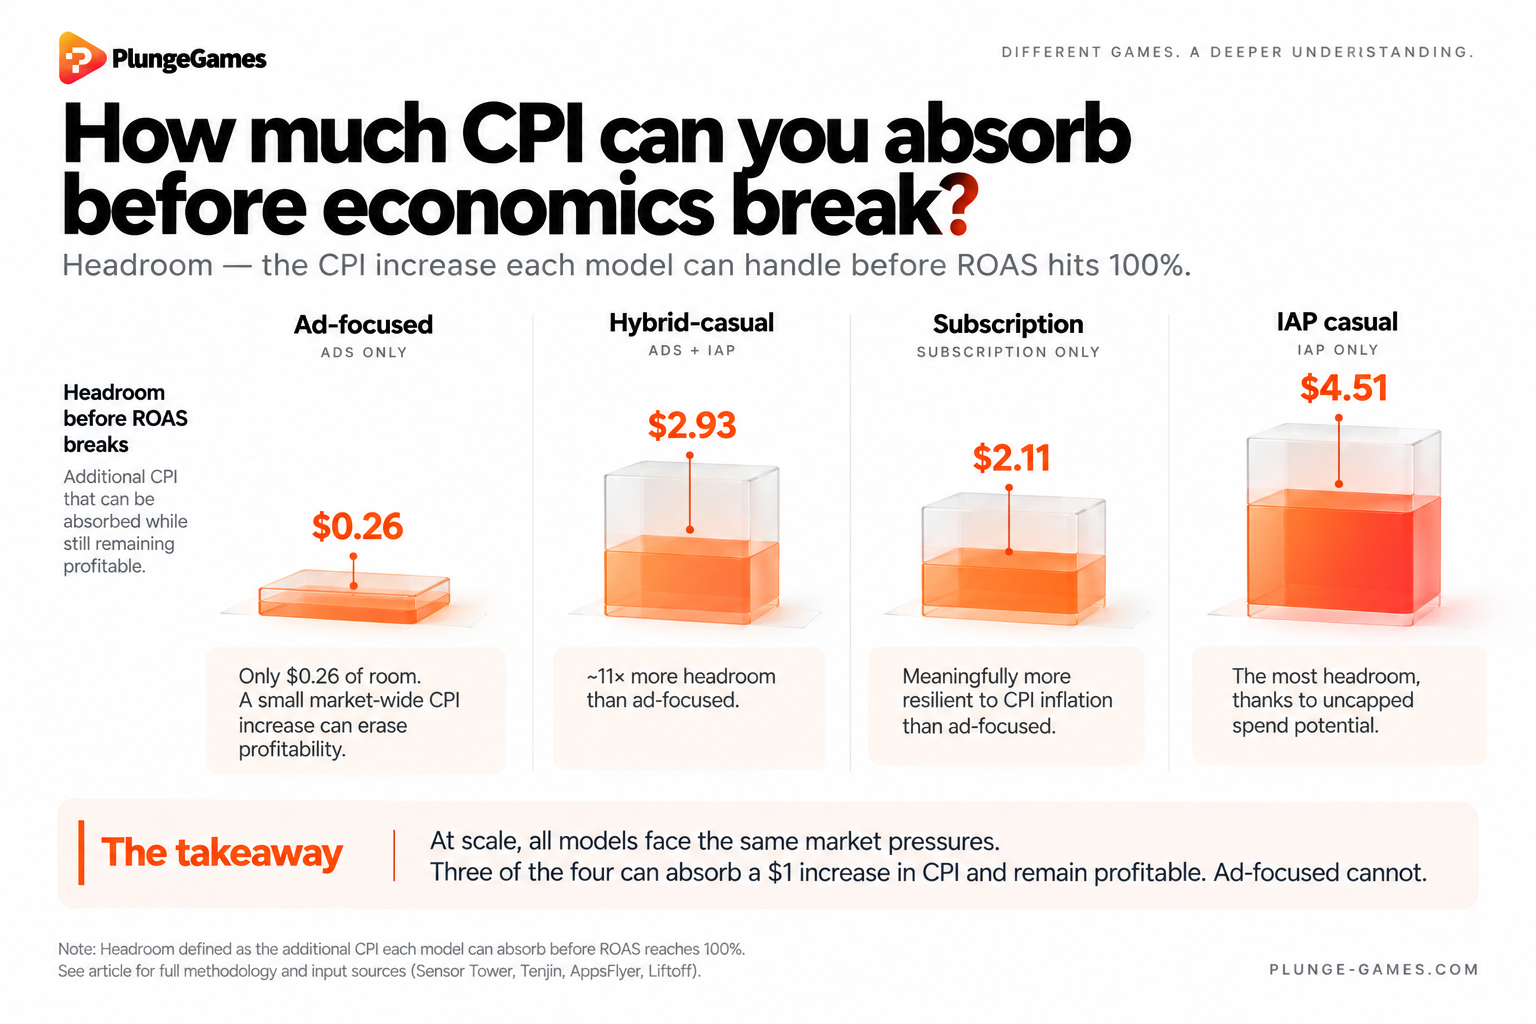
Every model has a maximum CPI it can absorb before it stops being profitable, called headroom. This is the point where what you spend to acquire a user exceeds what that user ever returns: $0.26 for ad-focused, $2.93 for hybrid, $4.51 for IAP casual, $2.11 for subscription.
Model | CPI today | Break-even CPI | Headroom |
Ad-focused | $0.65 | $0.91 | $0.26 |
Hybrid-casual | $4.25 | $7.18 | $2.93 |
IAP casual | $12.00 | $16.51 | $4.51 |
Subscription | $4.00 | $6.11 | $2.11 |
Add a dollar to CPI across the board - a realistic market-wide move, since at scale these models compete for the same inventory - and three of the four are still profitable. Only an ad-focused model is not. It has $0.26 of room, which the market can erase without anyone making a single bad decision.
Spend $1M across the four models and you get different answers depending on whether your binding constraint is budget or scale.
Model | Installs | Profit |
Hybrid-casual | 235k | $689k |
Subscription | 250k | $528k |
Ad-focused | 1,538k | $400k |
IAP casual | 83k | $376k |
If you're allocating a fixed budget and want the most profit from it, hybrid wins. If you've already saturated your install volume and need every user to be worth more, IAP wins. And at scale, install volume is almost always the binding constraint.
That's the tension a single ROAS number hides: IAP casual looks like the worst return per dollar spent today, but it's also the model with the highest ceiling per user over time. The practical implication is sharpest for subscription. It isn't built to scale through paid UA the way an IAP model is because the ceiling is fixed at the price, so the bid is fixed too. Treating the two as interchangeable is how teams put real money into an auction their unit economics can't win.
What each model gets wrong about itself
Every model misreads its own constraint. Usually because teams benchmark against the wrong competitor, optimize the wrong metric, or mistake a measurement problem for a business problem.
Ad-focused
Acts like a model that scales on user value - running more spend, chasing growth - when the only lever it actually has is volume. Revenue per user is capped by attention: no user can watch more than a finite number of ads. You can buy more users, but you cannot make each one worth more. The metrics that matter are session depth and ad fill rate, rather than install count.
Hybrid-casual
When benchmarked against hypercasual on D7 ROAS, it loses out: 28% against 47%. But the IAP layer is what makes a more expensive user worth buying. Growth here comes from better users, not cheaper ones.
IAP casual
If chasing short-term ROAS at scale and capping bids accordingly, it prices out the users it most needs. The highest-value payers are often late converters: they take time to find the thing worth spending on. Optimizing for short-term ROAS systematically excludes these users before they've had a chance to spend.
Subscription
Treats growth like an organic problem - content quality, product improvements, word of mouth - when it's actually bidding in the same paid auction as everyone else. Every lever you have moves how many people convert. None of them move what a converted user is worth. When the unit economics appear to not support paid UA, that's usually a measurement problem, not evidence that the model can't scale.
What consumer apps can take from this
In 2025, consumer spend on non-game apps surpassed games for the first time: $85.6B against $81.8B, growing 21% against 1%. Downloads have fallen five years running while spending climbed. Roughly 7x more subscription apps now launch each month - from around 2,000 to more than 14,700 in 2022.
More money in the category, more apps competing for the same users, and a subscription price that hasn't moved. The bid pressure is real. The ceiling is self-imposed. Three things games figured out can help consumer apps with these challenges:
Uncap the revenue
Your subscription price determines how much revenue you can ever generate per user. That number sets your bid ceiling in the UA auction: you can't profitably spend more to acquire a user than they'll ever return. So a fixed subscription price isn't just a monetization decision. It's a cap on how aggressively you can grow.
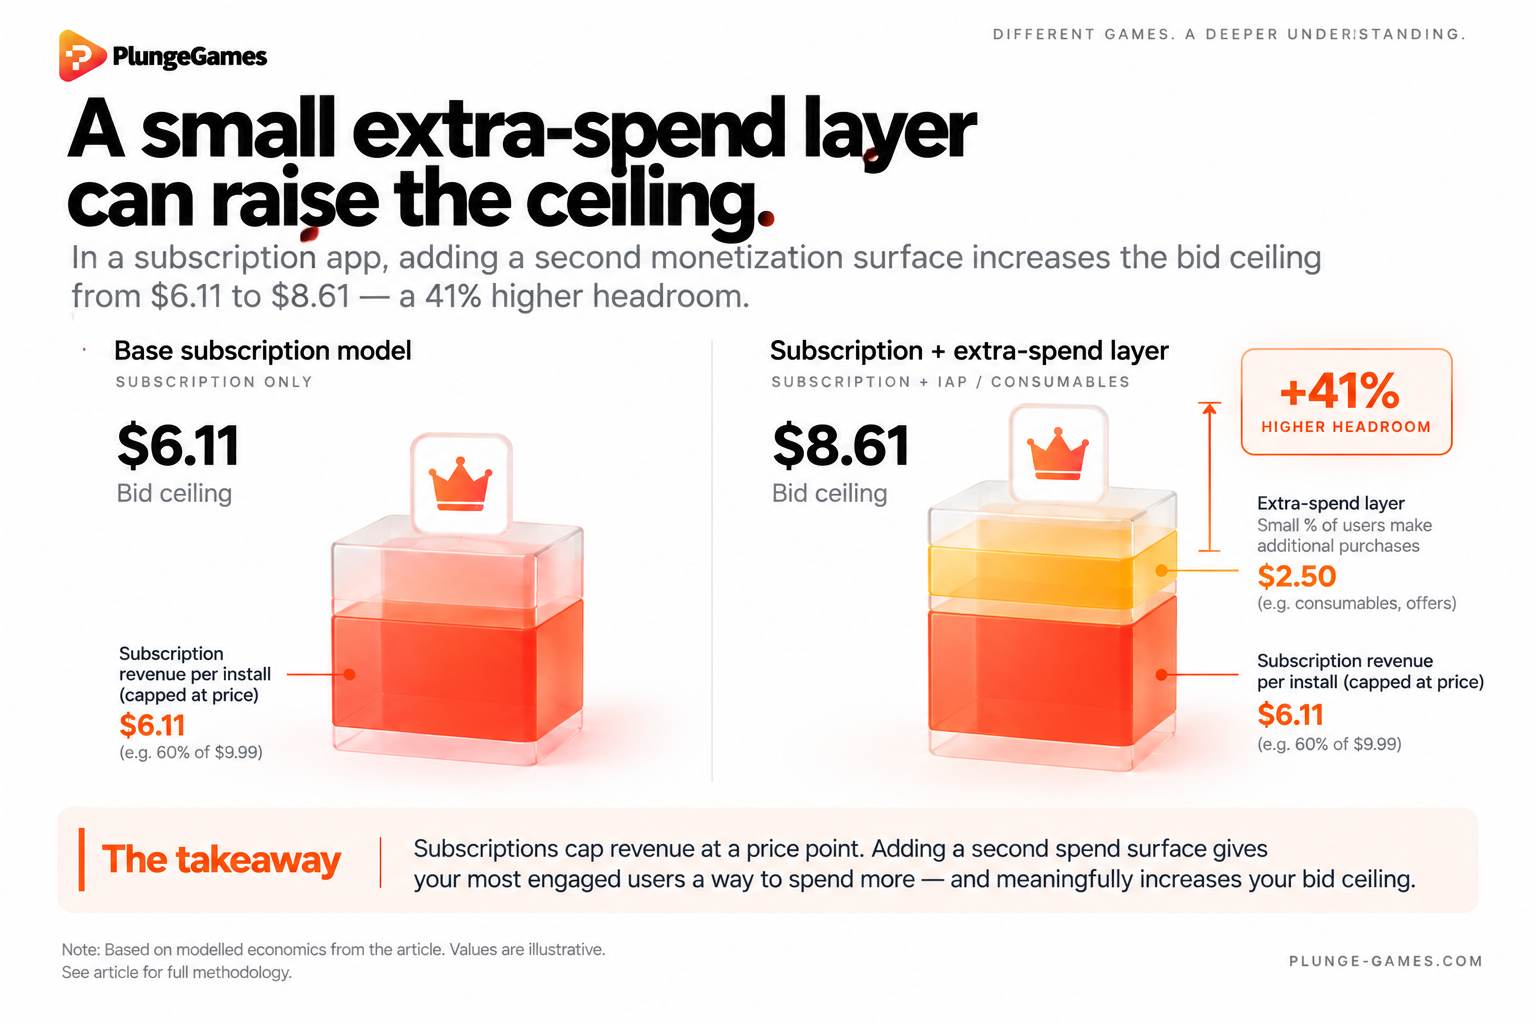
The fix isn't replacing the subscription. It's adding a second surface where users who want to spend more actually can. It doesn't need to carry most of your revenue to move the math. If 1 out of every 20 users spends an extra $25 a year, ARPPU rises ~40% and your bid ceiling moves from $6.11 to $8.61. That $2.50 gap opens a band of users who were unprofitable to acquire before.
Onboarding is economy design
55.4% of three-day trial cancellations happen on day zero, before the user has experienced anything worth paying for.
Gaming treats onboarding as an economic problem: every screen that adds friction before delivering value is a conversion you're giving up. The design principles that follow from that are simple:
One action per screen
Value before friction
A visible win inside the first sixty seconds
One new system introduced at a time
Most consumer apps treat onboarding as a copywriting problem, but games spent fifteen years learning it's not.
Build things worth keeping
Games don't just sell access - they build things that users accumulate: streaks, milestones, collections, visible status, personal history. Games monetize attachment, and that’s what makes monetization feel natural rather than extractive.
A user with two hundred days of history, a half-finished collection and a rank their friends can see will buy a $2.99 item without thinking about it. A user with none of those won't, at any price, on any paywall. This isn't about charging loyal users more; it's about giving them something worth buying.
Conclusion
Same metrics, different physics. Once you know which set yours runs on, most of the hard decisions stop being hard.
The one number worth taking away is D365 ÷ D30, which tells you how much of your first year arrives after the first month.
For anyone who wants to get into the numbers directly, get in touch with me and the Plunge team right here.